


Normally the mere mention of a spreadsheet can bring a distant glaze across the eyes of most creatives – the file format perceived as the antithesis of imagination by those desiring to create rather than tabulate. But Australian landscape architect Emma Stevens imagined the mundane Excel spreadsheet as an opportunity rather than an impediment to exploring art, using a tried and true technique of type as a medium to create a vast skyline out of text and cells.

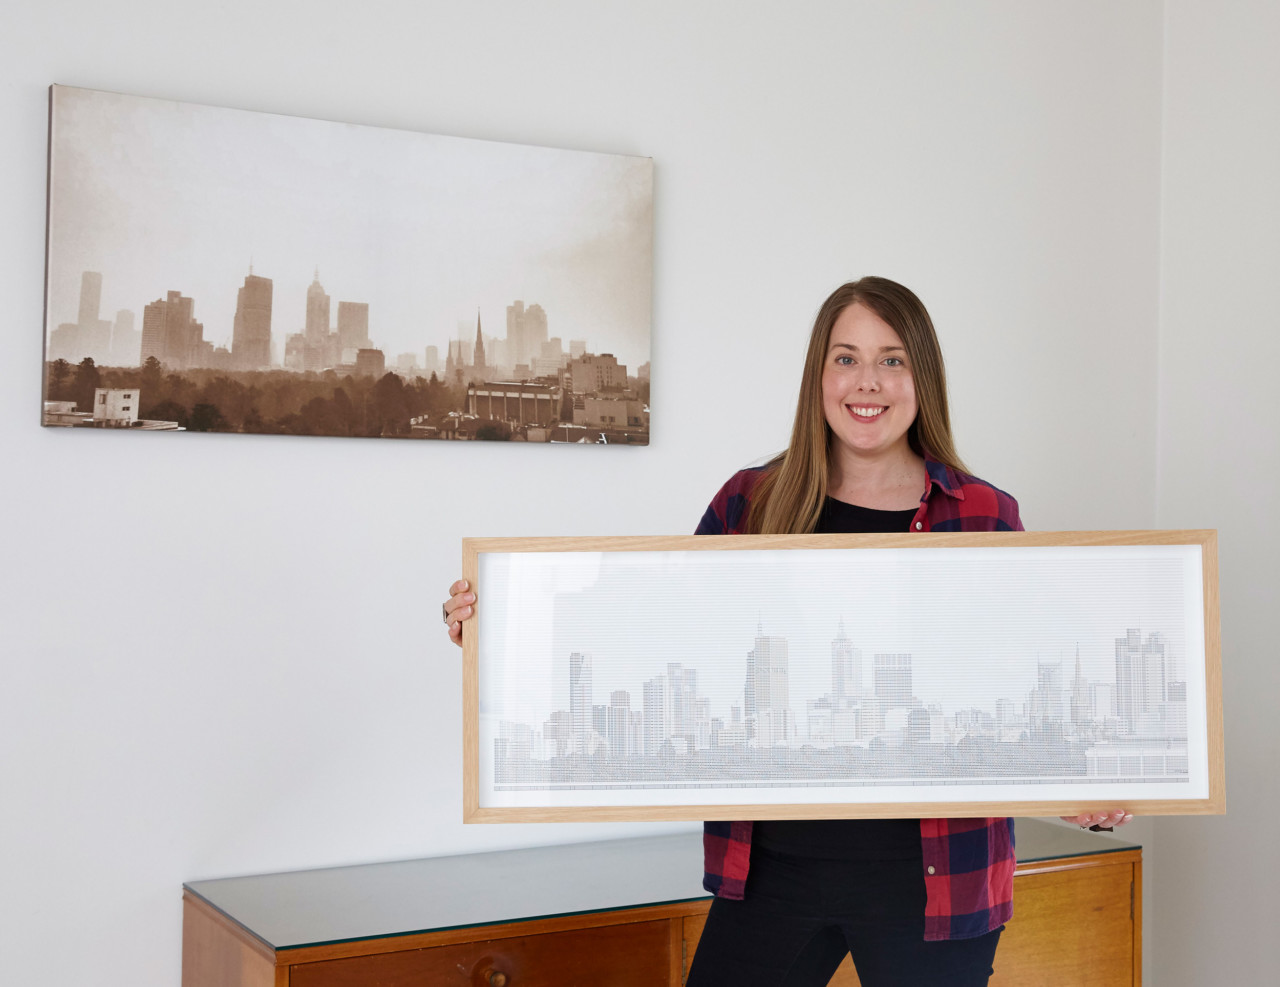
Inspired by the second-largest city in Australia, Stevens envisioned recreating the architectural skyline in a fashion older computer natives may remember similar to ASCII artwork – images created using letters, numerals, and symbols to render details. In this instance, using Excel as a canvas, “Melbourne” was typed and stacked in multitude across numerous spreadsheet cell rows, with sectioned columns defining the vertical reach of individual buildings, and column breaks and letter shading create the illusion of depth. We interviewed Stevens about her unusual combined affinity for spreadsheets and architecture.

The illusory creation is most evident at normal viewing distance from a laptop screen.
It begs asking: Why an Excel spreadsheet as a canvas?
It began after I came across a piece of art at MoMA, New York comprised of jargon text arranged in horizontal lines. From a distance (with a slight head tilt) I thought it looked like a series of buildings. It was then I wondered whether I could “build” a skyline out of the name of the city. I had also recently moved into an apartment which had a stunning panoramic view of the skyline of Melbourne, so my view became the subject of many artworks at the time.
Excel was the first thing that came to mind when I began imagining how to arrange text in a column-like manner to render vertical buildings. Creating using Excel also means I can print the piece at multiple scales. The piece is currently for sale at 940 x 340mm, however I can also create larger prints and retain a sharp resolution.

“I love a good spreadsheet. So much so, my friends once gifted me a ‘I ❤ Spread Sheets’ mug!”
How long does the average piece take you to compose?
I estimate it took in excess of 300 hours until I had the Melbourne piece finished. I “built” the skyline one letter at a time, one building at a time, for the good part of a year during any free time I could find when I wasn’t working at my full-time job as a landscape architect. This included compiling the letters into buildings, and also editing and formatting the color and style (bold/regular) to create shadow and depth for individual buildings and also the skyline as a whole.

Noting you used the Surface Book 2 – a touch capable computer – did you rely on the touchscreen, or did you use the Surface Pen (or a combination of both)?
I use both touch and keyboard. I’ve been meaning to experiment with the Surface Pen in future, but for more illustrative works.

Noting these skylines are “built” stacking letters, how do different fonts affect the eventual composition?
The Skyline is comprised of a default Microsoft Calibri Font, size 5. I learnt halfway through creating this piece that each particular font type within Excel has slightly different proportions. Any change to the font would space out the buildings differently, causing them and the whole skyline to become illegible (so the font always remained as my initial choice).
Bold fonts are slightly larger than a regular font, and some colors caused letters to become slightly larger – another challenge when I was attempting to establish the vertical lines within buildings.

Are there any future skylines in the work?
Melbourne has been the only skyline I have completed to date in this style. I have had a few suggestions on Instagram (from fans of the piece) for other cities such as Pittsburgh, Nashville, and Brisbane (Australia). However my aim is to tackle some of the more “iconic” skylines such as New York, London, and Tokyo next.
I also plan to revisit this Melbourne skyline and add some more buildings (there has been a lot of development and buildings popping up across Melbourne since I began this piece). The nature of digital art and an Excel “canvas” means I can edit the original file and make updates over time.